The (Data) Plot Thickens - You’ve generated a ton of data. How do you analyze it and present it? Sure, you ca... - https://hackaday.com/2025/08/28/the-data-plot-thickens/ #datavisualization #jupyternotebook #softwarehacks #dataanalysis #labplot

The (Data) Plot Thickens - You’ve generated a ton of data. How do you analyze it and present it? Sure, you ca... - https://hackaday.com/2025/08/28/the-data-plot-thickens/ #datavisualization #jupyternotebook #softwarehacks #dataanalysis #labplot

#LabPlot isn't exactly an open-source #MATLAB, but it is a an open-source and cross-platform tool for visualizing and analyzing data.
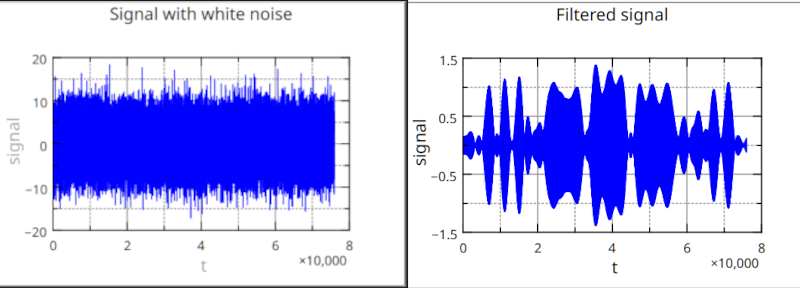
It focuses on creating interactive scientific plots and offers features like curve fitting, Fourier and Hilbert transforms, data manipulation, and live data support.
Computing with e.g. #Python, #R, #Maxima is also possible with interactive notebooks available in LabPlot.
You can see a list of LabPlot features here:
We’re announcing the 2.12.1 minor patch release of #LabPlot with small improvements and bug fixes. 

https://labplot.org/2025/08/18/labplot-2-12-1-released/
We recommend everybody update to this patch release which is available from our download page:
New features and enhancements are coming in the next major release. Stay tuned!
#FLOSS #FOSS #OpenSource #DataAnalysis #DataViz #Science #Statistics #Research #NLNet
@labplot@lemmy.kde.social @opensource @alternativeto @omgubuntu @9to5linux @NGIZero
After the release for gear 25.08 LabPlot will get a revision bump (rebuild) for Haiku, updated Cantor will be on the base for this, but also enabling Haiku's own icons in the layout. Stay tuned. :)
@LabPlot #HaikuOS #haikuports #KDE #LabPlot #opensource #science #visualization #analysis
Labplot 2.12.0 has been out for Haiku since it's release. Enjoy! :)
LabPlot is a FREE, open source and cross-platform Data Visualization and Analysis software accessible to everyone.
Prawo Benforda, znane również jako prawo pierwszej cyfry, może być użytecznym narzędziem w wykrywaniu anomalii.
Rozkład liczb w wynikach R. Trzaskowskiego w komisjach wyborczych w drugiej turze wyborów prezydenckich w Polsce nie przypomina rozkładu Benforda.
Wykorzystanie prawa Zipfa do identyfikacji wartości odstających w drugiej turze wyborów prezydenckich w Polsce.
Nietypowe są wartości odbiegające od liniowej linii trendu. Jest 1260 komisji, dla których wartość zarejestrowanych głosów na R. Trzaskowskiego jest nietypowa.
Zipf's law used to identify outliers in the second round of Poland's presidential election.
In this example outliers are values that deviate from a linear trend line. There are 1260 district election committees for which the number of registered votes for R. Trzaskowski is unexpected.
#LabPlot, the project for #statisticians, #researchers, #scientists, #engineers, #educators and #students, publishes version 2.12 of its #FREE comprehensive #dataAnalysis and #visualization tool. 
This version adds more plots and #plot sub-types, expands the number of functions for spreadsheets, includes new analysis tools, as well as an experimental software development kit.
The project is partly funded through @NGIZero.
@LabPlot at the service of #science and #researchers! 


@labplot@lemmy.kde.social @opensource @openscience
#LabPlot is a FREE, open source and cross-platform Data Visualization and Analysis software.
Boosts appreciated! 

We're pleased to know that #LabPlot was used to perform calculations in this recent study on robust access to furo-fused #heteropolycycles:
The number of new posts published on Mastodon.social. 
@Mastodon @JohnMastodon @fediverse @labplot@lemmy.kde.social
@europesays @UnitedStates @labplot@lemmy.kde.social @dataisbeautiful
Has the #FertilityRate in the #US been stable over the past two decades? And how does it compare to the #EU?
Boosts appreciated! 

Has the #FertilityRate in the #EuropeanUnion been stable over the past two decades?
A simple #XmR chart available in @LabPlot can be used to track the stability of any process.
Boosts appreciated! 


#Europe #Future #EU #Europa #Fertility #Politics #Children #BirthRate #Demography #Population #Biology #Family #Community #Statistics #FreeSoftware #OpenSource #Shewhart #ControlChart #LabPlot #Data #dataViz
#LabPlot is a FREE, open source and cross-platform Data Visualization and Analysis software accessible to everyone. In LabPlot your #data is yours alone!
In this short video you can learn how to quickly import your data into #LabPlot and visualize it.
Boosts appreciated! 

@opensource @openscience @alternativeto @9to5linux @omgubuntu
#LabPlot Team Loves #FreeSoftwareDay! 
@fsfe
@opensource @libre_software @libre_culture
Boosts appreciated! 
#LabPlot at the service of #science and #researchers!
Boosts appreciated! 

We're pleased to know that #LabPlot was used in this recent study on ceftazidime-avibactam (CZA) tolerance/persistence:

#LabPlot at the service of #science and #researchers!
Boosts appreciated! 

It's rewarding to us to know that LabPlot was used for #DataVisualization in this recent study on oxidative and excitatory neurotoxic stresses:

Today is the Data Privacy (Protection) Day! So let us remind you that in #LabPlot, an open-source data analysis and visualization software, Your Data is Yours!
@labplot@lemmy.kde.social @opensource @libre_software @privacy
Boosts appreciated! 


#LabPlot at the service of researchers.
It's rewarding to us to know that LabPlot was used for #DataVisualization in this recent study on metastatic breast cancer:
